Scenario engine for the world economy · 2026 to 2030
Rehearse the next shock before the world lives it.
Describe an export ban, a tariff, a blockade or a closed strait in plain English. The Future Simulator traces it through 2.6 million trade flows, the supply chains of 80 economies and the likely responses of 33 governments, then shows who loses, who gains and why.
- economies with data from 2000 to 2031
- 218
- economies with data from 2000 to 2031
- bilateral trade flows behind every run
- 2.6M
- bilateral trade flows behind every run
- economies' industry supply chains (OECD)
- 80
- economies' industry supply chains (OECD)
- governments modelled in depth
- 33
- governments modelled in depth
How it works
From a sentence to a forecast
- 01
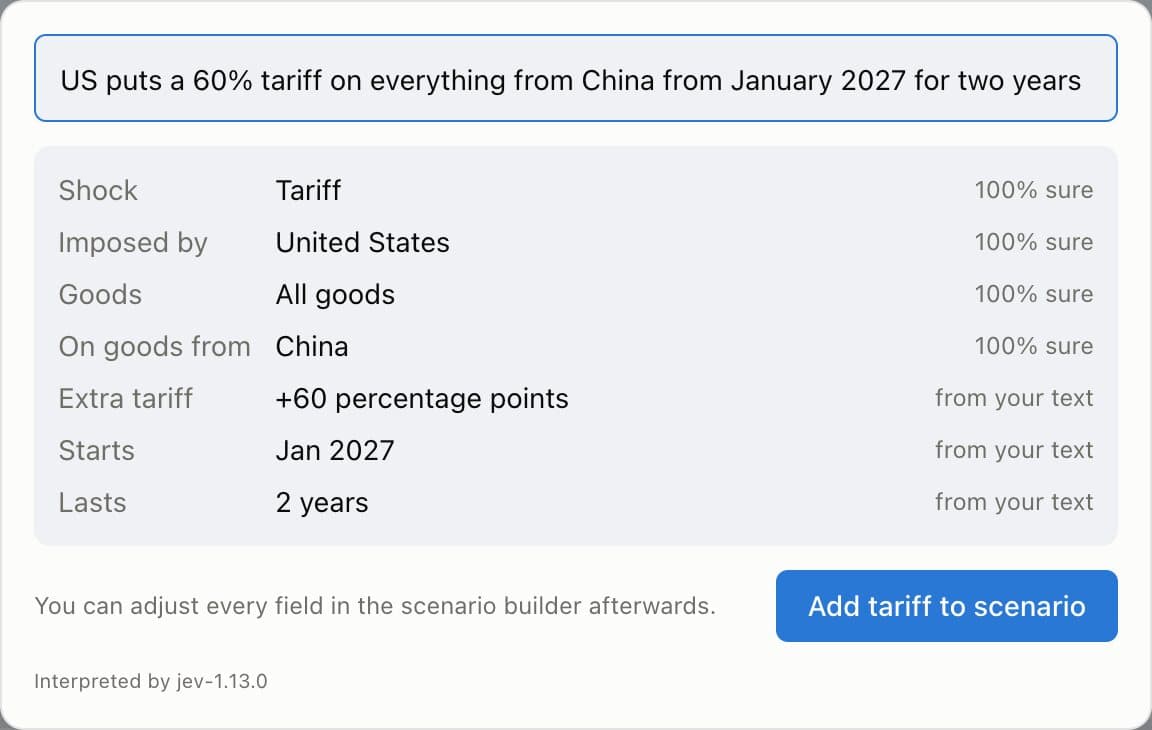
Describe the shock
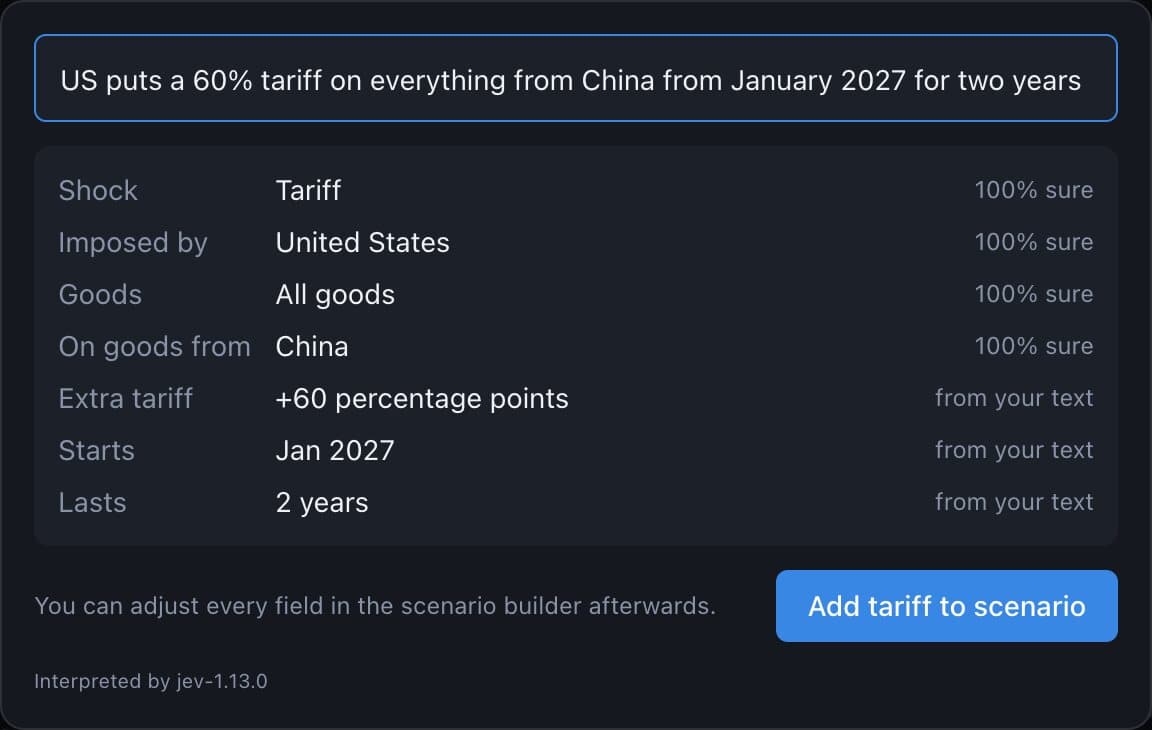
Type what worries you. The assistant drafts the scenario field by field and shows how sure it is of each one. Explicit numbers come from your words, never from a model, and nothing runs until you confirm.
- 02
Trace the ripple
A deterministic engine moves the shock through trade, prices, shortages and industry supply chains, year by year to 2030, and shows the uncertainty range across 30 sets of assumptions.
- Export volumes
- World prices
- Shortages and supply chains
- Trade costs
- Workers
Kuwait, 2027Scenario: The Strait of Hormuz closes for six months-10.4% - Export volumes-8.4 pts
- World prices+0.5 pts
- Shortages and supply chains-2.5 pts
- Trade costs0.0 pts
- Workers0.0 pts
Contribution of each channel to the change in real GDP against the baseline, in percentage points.
- 03
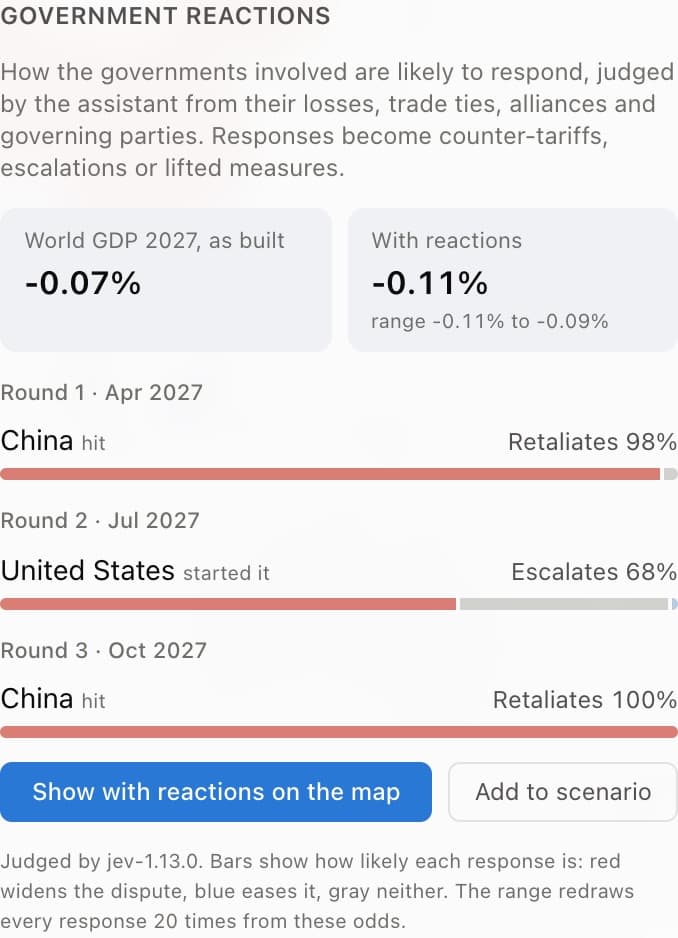
Watch governments respond
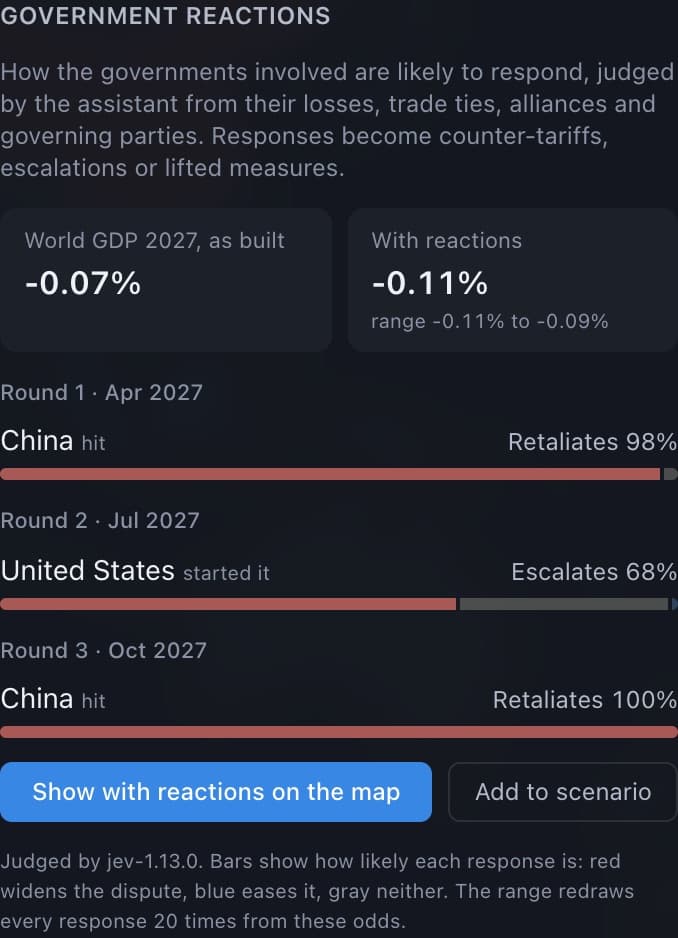
Countries hit by a measure retaliate, negotiate, reroute or comply; close allies may join; the instigator escalates or backs down. Each response becomes a concrete shock, with its odds shown.
Scenarios
Five kinds of shock, any country, any timing
Export restrictions
Bans and quota cuts on 22 strategic goods, from crude oil and rice to rare-earth magnets and chipmaking tools.
Tariffs
New duties on one partner or on everyone, layered on the tariffs already in force since 2025.
Blockades
A country cut off from trade by sea and land, and everyone downstream of its goods.
Strait and canal closures
Hormuz, Suez, Bab el-Mandeb, Malacca, Panama, the Bosporus and the Taiwan Strait, with detours where they exist.
Migration shifts
Fewer arrivals or more departures, felt through the working-age population and output.
Combine shocks, switch off the disruptions already in force, save scenarios and share them with colleagues.
Results to 2030, by country and year
Political dynamics
Politics, not only prices
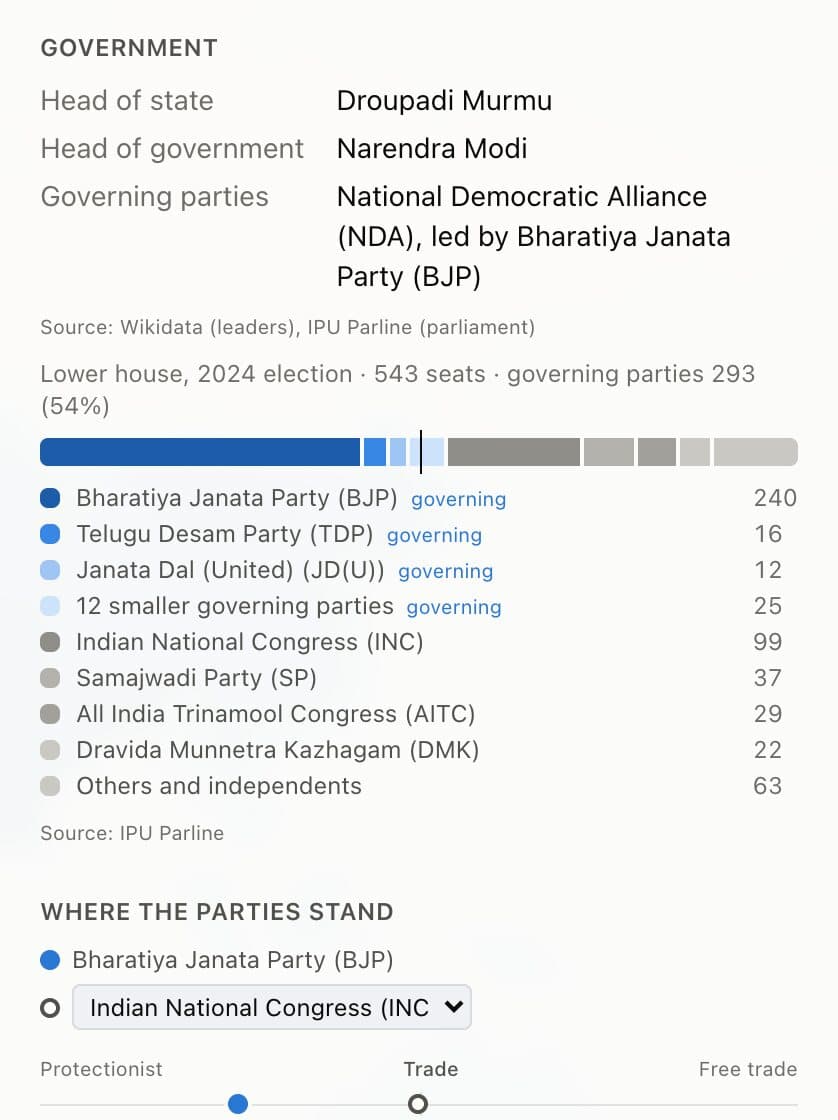
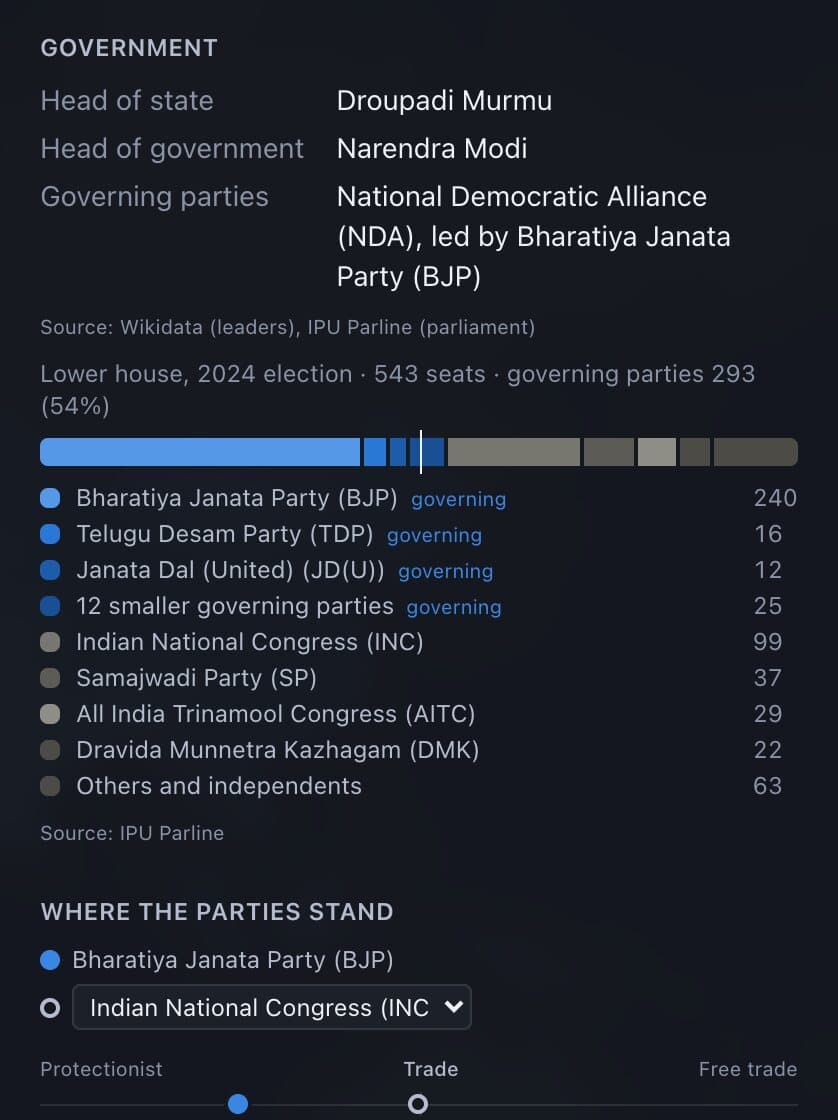
Who governs shapes how a country responds. The Future Simulator knows the latest parliament of every major economy, where its parties stand and how friendly it is with everyone else.
- Seats and governing parties from official parliamentary records
- Party positions on trade, the economy, energy, alignment, budgets and migration, each citing its source
- A friendliness index built from UN votes, alliances, trade agreements, rivalries and sanctions
- Put another party in power and see whether the response changes
Evidence
Calibrated on crises that already happened
Every input comes from a published, cited source and traces back to the file it was read from; every result is computed by the engine from those inputs. The engine replays real episodes on the data of the year before and reports how far off it was. Two of its settings were tuned on these same episodes, so the table shows how well it fits them, not an independent test.
Where it falls short, it says so: critical-mineral price spikes driven by hoarding, as in 2011, come out conservative.
- World Bank
- IMF
- United Nations
- OECD
- CEPII
- Energy Institute
- USGS
- IMF PortWatch
- Yale Budget Lab
- IPU Parline
- WTO
- Natural Earth
| Measure | Actual | Model |
|---|---|---|
| US-China trade war, 2018 to 2019 · mean absolute error 0.8 across 5 measures | ||
| China's share of US imports | -3.2 pts | -5.4 pts |
| Vietnam's share of US imports | +0.6 pts | +0.2 pts |
| Mexico's share of US imports | +1.0 pts | +1.1 pts |
| US share of China's imports | -2.7 pts | -2.3 pts |
| US share of China's soybean imports | -11.0 pts | -10.2 pts |
| Sanctions on Russian energy, 2022 to 2023 · mean absolute error 3.8 across 4 measures | ||
| Russia's share of EU crude imports | -19.9 pts | -20.6 pts |
| Russia's share of India's crude imports | +33.9 pts | +23.8 pts |
| Russia's share of China's crude imports | +5.0 pts | +4.3 pts |
| Russia's crude export volume | -10.3% | -6.6% |
Shares are a percentage of the importer's goods imports by value, so their changes are in percentage points; export volume is in tonnes. Actual changes are from CEPII BACI trade data and include everything else that happened at the time.
Security
Private by design
Invitation only
Access is requested, reviewed by an administrator and granted through a single-use invitation.
Strong sign-in
Hashed passwords, account lockout and two-factor authentication for administrators.
AI that judges, never invents
The assistant interprets and chooses. Every number is computed by the engine from published data.
Everything on the record
Sign-ins, approvals and role changes are written to an audit log.
Bring your hardest what if.
Stress-test supply chains, sanctions and trade policy before events force the question.